History Jobs Update
Out of a train-wreck curiosity about what’s been happening to the historical profession, I’ve been watching the numbers on tenure-track hiring as posted on H-Net, one of the major venues for listing history jobs.
[Update 10-2: switching to US and Canada only. An earlier version of this included other countries, even though I said it didn’t.]
We’re now into October. Usually–I know now–this is the period by which half the tenure-track jobs for any cycle have been listed. With two important exceptions I’ll get into later, every year since 2004 passed the halfway point for the year in the last week of September or the first week of October.
So here are a few ways of looking at the hiring patterns.
One is the aggregate tenure-track jobs listed by year. (I’m filtering here not just to tenure-track positions, but also to jobs in the United States with “history” in the primary category field, which are typically things like “Asian History / Studies”. The core H-Net audience is the history profession and the US, so we’ll get less noise limiting this way.)
Here you can see a few things:
H-Net took some time to get off the ground in 2003-2007. You’d be better looking at the AHA listing for this period, But nonetheless;
The period before 2008 was much better–almost twice as many jobs a year– as the period since.
2009 was the worst year on the record to this point, with about 200+ jobs listed by early October; currently we’re still short of 100.
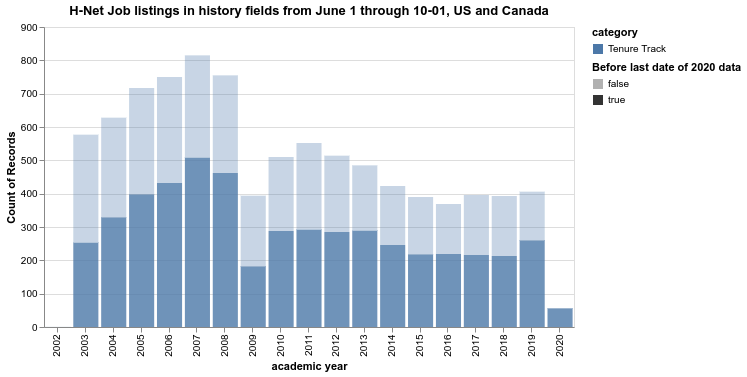
2020 is much worse than any other year
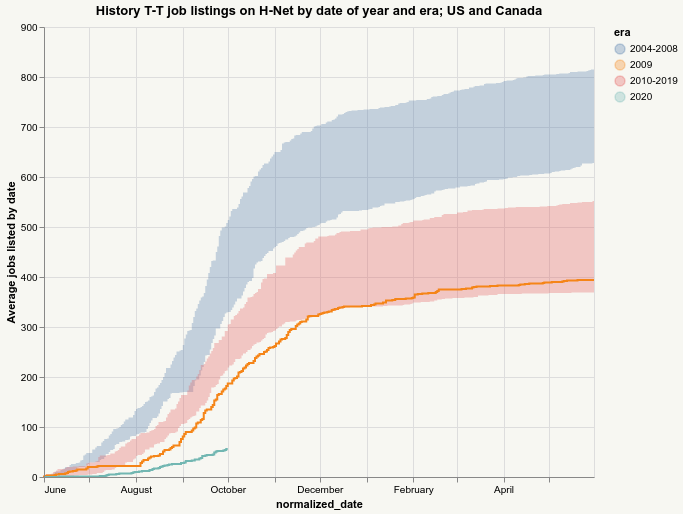
This chart shows how the number of listings over time in this academic year compares to the two other eras in the hiring cycle: 2004 to 2008, and 2010 to 2019. It’s worth noting a couple things here. First, the worst of the pre-great-recession years was better than the best year since it. Second, I’ve broken out 2009, the only year that compares to the current one in its low numbers through September, but as you can see 2009 did recover to have more tenure track jobs, in the end, than the worst year of the 2010s. (One of the worst years of that decade, it’s worth noting, was 2019; even as majors approached stability, new listings for tenure-track jobs were disappearing last year.)
Annual Cycle.
Overall, we can see what the next couple months are likely to look like by looking at the annual cycle of jobs. Typically the flood comes in late September; you get a couple a day through Thanksgiving; and then after a slight December rebound, the rest of the spring is perhaps a single job a day publicly listed.
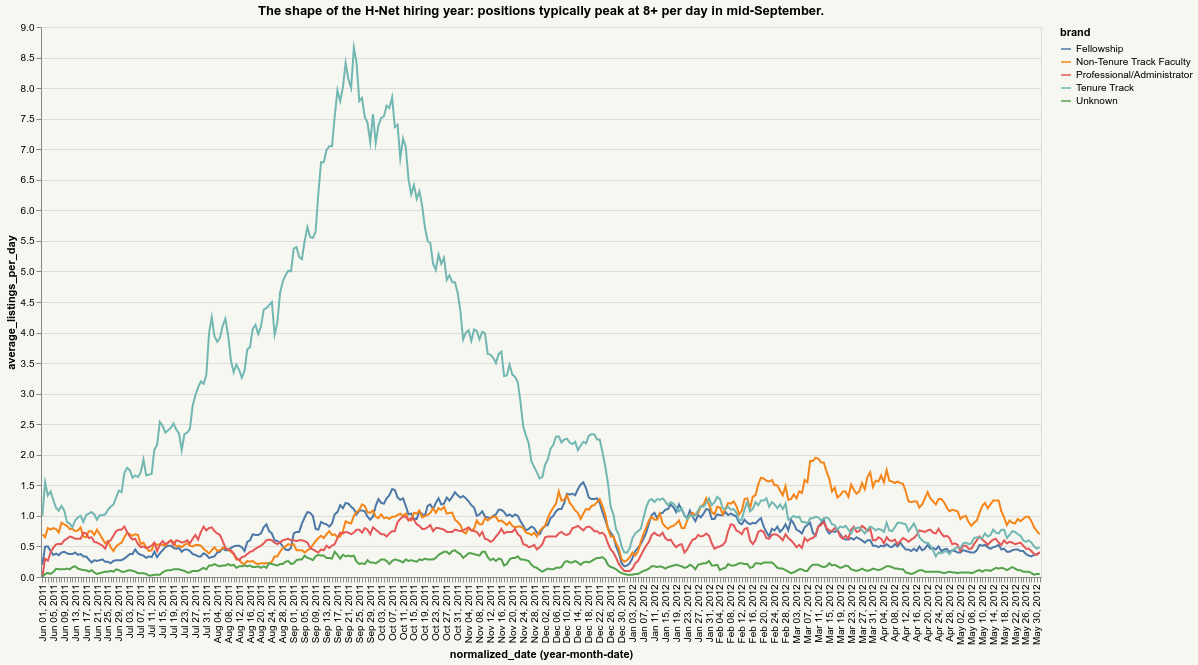
Shape of annual hiring peaks in mid-September